Multiple Choice
The graph shows sales in thousands of dollars for 1989 and 1990. Use it to answer the question
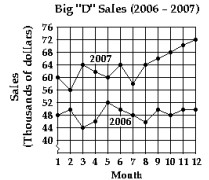
-Write an ordered pair that gives approximately the sales in June 2006.
A) (June, 50)
B)
C)
D)
Correct Answer:

Verified
Correct Answer:
Verified
Related Questions
Q42: The point with coordinates <span
Q43: Find the slope of the line.<br>-<img
Q44: Graph the linear inequality in two
Q45: Evaluate the function.<br>-Find <span class="ql-formula"
Q46: Graph the compound inequality.<br>- <span class="ql-formula"
Q48: Find the slope of the line
Q49: Determine whether the relation defines
Q50: Solve the problem<br>-Let <span class="ql-formula"
Q51: Decide whether the pair of lines
Q52: Tell whether the points are the