Multiple Choice
Graph the linear inequality in two variables.
- 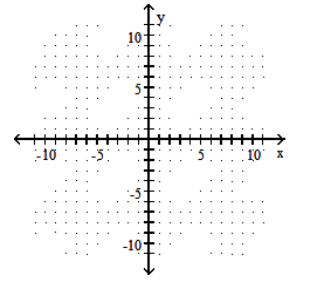
A) 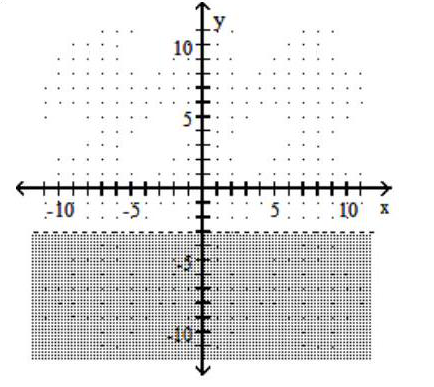
B) 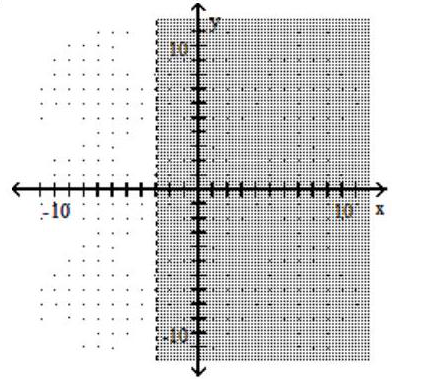
C) 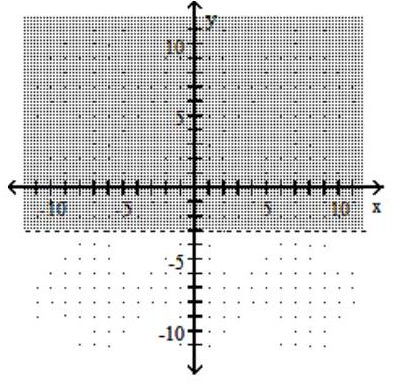
D) 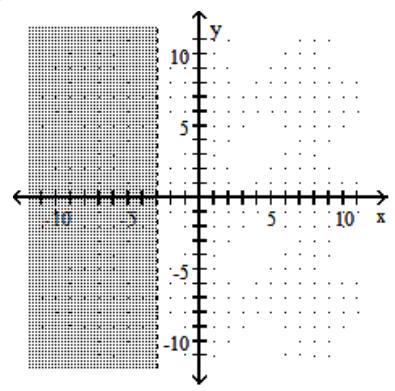
Correct Answer:

Verified
Correct Answer:
Verified
Related Questions
Q39: Find the <span class="ql-formula" data-value="x"><span
Q40: Find an equation of the line
Q41: Solve the problem.<br>-In 1980 , there were
Q42: The point with coordinates <span
Q43: Find the slope of the line.<br>-<img
Q45: Evaluate the function.<br>-Find <span class="ql-formula"
Q46: Graph the compound inequality.<br>- <span class="ql-formula"
Q47: The graph shows sales in thousands
Q48: Find the slope of the line
Q49: Determine whether the relation defines