Short Answer
Use the following figure that shows a firm's isoquant for producing 3,000 units of output and four isocost curves. Labor and capital each cost $100 per unit. 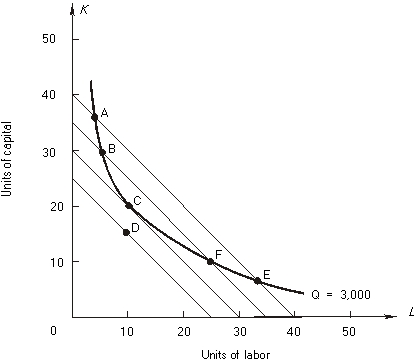
-By moving from A to B, the firm _______________ (increases, decreases) labor usage and _______________ (increases, decreases) capital usage. At point B the MRTS is _______________ (greater than, less than, equal to) the input price ratio, w/r. The movement from A to B _______________ (increased, decreased) total cost by $_________.
Correct Answer:

Verified
increases; decreases...View Answer
Unlock this answer now
Get Access to more Verified Answers free of charge
Correct Answer:
Verified
View Answer
Unlock this answer now
Get Access to more Verified Answers free of charge
Q8: A firm is using 20 units of
Q9: refer to the following figure:<br> <img src="https://d2lvgg3v3hfg70.cloudfront.net/TB10434/.jpg"
Q10: The following graph shows 2 isocost curves
Q11: refer to the following figure:<br> <img src="https://d2lvgg3v3hfg70.cloudfront.net/TB10434/.jpg"
Q12: Answer the following:<br>-The movement from E to
Q14: refer to the following figure:<br> <img src="https://d2lvgg3v3hfg70.cloudfront.net/TB10434/.jpg"
Q15: Answer the following:<br>-At point E, the MP
Q16: Using the above table, answer the following
Q17: Answer the following:<br>-At input combination C the
Q18: refer to the following:<br> <img src="https://d2lvgg3v3hfg70.cloudfront.net/TB10434/.jpg" alt="refer