Short Answer
The following graph shows 2 isocost curves for a firm. The price of capital is $200.
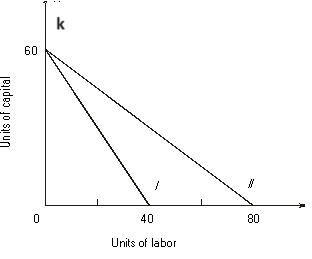
-The total cost associated with isocost I is $_________, and the price of labor is $_________.
Correct Answer:

Verified
Correct Answer:
Verified
Q5: The following graph shows 2 isocost curves
Q6: The following graph shows a firm's long-run
Q7: Using the above table, answer the following
Q8: A firm is using 20 units of
Q9: refer to the following figure:<br> <img src="https://d2lvgg3v3hfg70.cloudfront.net/TB10434/.jpg"
Q11: refer to the following figure:<br> <img src="https://d2lvgg3v3hfg70.cloudfront.net/TB10434/.jpg"
Q12: Answer the following:<br>-The movement from E to
Q13: Use the following figure that shows a
Q14: refer to the following figure:<br> <img src="https://d2lvgg3v3hfg70.cloudfront.net/TB10434/.jpg"
Q15: Answer the following:<br>-At point E, the MP