Short Answer
The following graph shows a firm's long-run average and marginal cost curves.
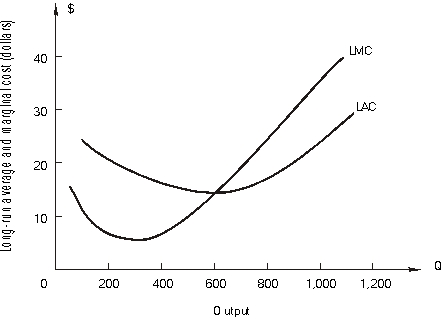
-At 900 units of output ATC = $_________ and MC = $_________.
Correct Answer:

Verified
Correct Answer:
Verified
Q1: The following graph shows 2 isocost curves
Q2: refer to the following:<br> <img src="https://d2lvgg3v3hfg70.cloudfront.net/TB10434/.jpg" alt="refer
Q3: Use the following figure that shows a
Q4: In the following figure, isoquant I is
Q5: The following graph shows 2 isocost curves
Q7: Using the above table, answer the following
Q8: A firm is using 20 units of
Q9: refer to the following figure:<br> <img src="https://d2lvgg3v3hfg70.cloudfront.net/TB10434/.jpg"
Q10: The following graph shows 2 isocost curves
Q11: refer to the following figure:<br> <img src="https://d2lvgg3v3hfg70.cloudfront.net/TB10434/.jpg"