Multiple Choice
refer to the following graph:
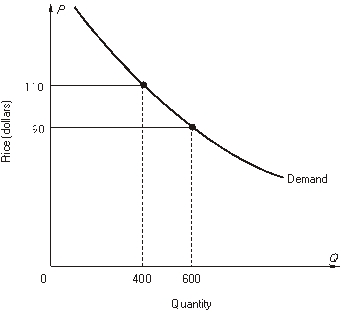
-The price elasticity of demand over the price interval $90 to $110 is
A) -0.5
B) -1.0
C) -1.5
D) -2.0
E) -0.4
Correct Answer:

Verified
Correct Answer:
Verified
Related Questions
Q12: Boeing estimates the elasticity of demand for
Q13: In the graph shown below, the demand
Q14: refer to the following table showing a
Q15: refer to the following figure:<br> <img src="https://d2lvgg3v3hfg70.cloudfront.net/TB10434/.jpg"
Q16: Fill in the blanks.<br>-When demand is unitary
Q18: E<sub>1</sub> is demand elasticity for Minute Maid
Q19: refer to the following table showing a
Q20: Use the figure below to answer the
Q21: refer to the following figure:<br> <img src="https://d2lvgg3v3hfg70.cloudfront.net/TB10434/.jpg"
Q22: Fill in the blanks.<br>-When demand is unitary