Short Answer
In the graph shown below, the demand for good X shifts due to a change in the price of a related good Y. Holding the price of good X constant at $200, answer the following questions:
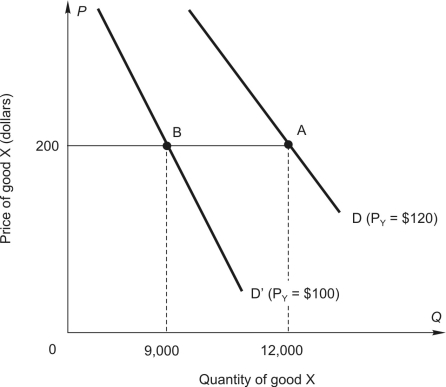
-The graph shows how the demand for X shifts when the price of related good Y decreases from $120 to $100. Using the information in the graph, the cross-price elasticity of
demand for X and Y is calculated to be _________.
Correct Answer:

Verified
Correct Answer:
Verified
Q8: Use the linear demand curve shown below
Q9: refer to the following figure:<br> <img src="https://d2lvgg3v3hfg70.cloudfront.net/TB10434/.jpg"
Q10: Fill in the blanks.<br>-If price rises and
Q11: Boeing estimates the elasticity of demand for
Q12: Boeing estimates the elasticity of demand for
Q14: refer to the following table showing a
Q15: refer to the following figure:<br> <img src="https://d2lvgg3v3hfg70.cloudfront.net/TB10434/.jpg"
Q16: Fill in the blanks.<br>-When demand is unitary
Q17: refer to the following graph:<br> <img src="https://d2lvgg3v3hfg70.cloudfront.net/TB10434/.jpg"
Q18: E<sub>1</sub> is demand elasticity for Minute Maid