Multiple Choice
refer to the following graphs:
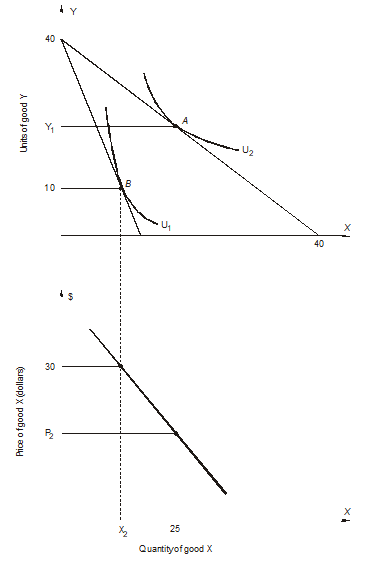
The price of Y is $15 per unit.
-What is
A) 10
B) 12
C) 18
D) 20
E) none of the above
Correct Answer:

Verified
Correct Answer:
Verified
Q30: refer to the following figure:<br> <img src="https://d2lvgg3v3hfg70.cloudfront.net/TB10434/.jpg"
Q31: The following figure shows a portion of
Q32: refer to the following figure:<br> <img src="https://d2lvgg3v3hfg70.cloudfront.net/TB10434/.jpg"
Q33: The marginal rate of substitution of X
Q34: If a demand curve slopes upward, then<br>A)
Q36: Use the following graph showing a consumer's
Q37: refer to the following graph:<br> <img src="https://d2lvgg3v3hfg70.cloudfront.net/TB10434/.jpg"
Q38: refer to the following figure:<br> <img
Q39: When the price of a good changes,<br>A)
Q40: The following figure shows a portion of