Short Answer
The following figure shows a portion of a consumer's indifference map and budget lines. The price of good Y is $17 and the consumer's income is $7,650.
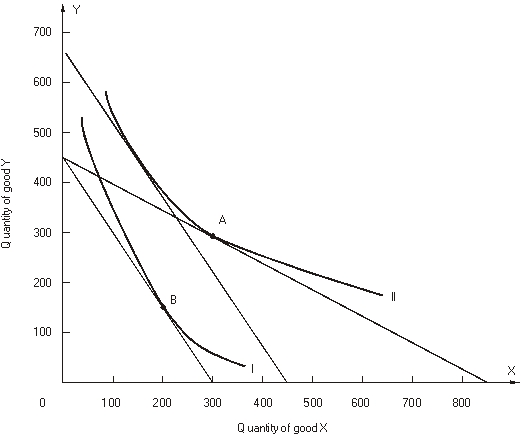 Let the consumer begin in utility-maximizing equilibrium at point A on indifference curve II. Next the price of good X changes so that the consumer moves to a new utility-maximizing equilibrium at point B on indifference curve I.
-Good X is a(an) ____________ good.
Correct Answer:

Verified
Correct Answer:
Verified
Q35: refer to the following graphs:<br> <br> <img
Q36: Use the following graph showing a consumer's
Q37: refer to the following graph:<br> <img src="https://d2lvgg3v3hfg70.cloudfront.net/TB10434/.jpg"
Q38: refer to the following figure:<br> <img
Q39: When the price of a good changes,<br>A)
Q41: F Mary is consuming 3 hot dogs
Q42: The marginal rate of substitution of X
Q43: Demand curves slope downward because<br>A) the substitution
Q44: If the total utility of five units
Q45: Sally consumes only two goods, A and