Short Answer
The following figure shows a portion of a consumer's indifference map and budget lines. The price of good Y is $7 and the consumer's income is $700.
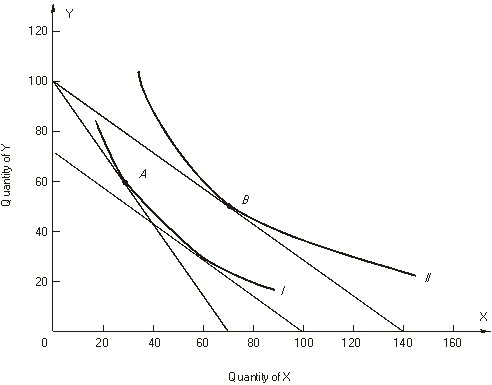 Let the consumer begin in utility maximizing equilibrium at point A on indifference curve I. Next the price of good X changes so that the consumer moves to a new utility maximizing equilibrium at point B on indifference curve II.
-Good X is a(an) ______ good.
Correct Answer:

Verified
Correct Answer:
Verified
Q42: The marginal rate of substitution of X
Q43: Demand curves slope downward because<br>A) the substitution
Q44: If the total utility of five units
Q45: Sally consumes only two goods, A and
Q46: Use the following graph showing a consumer's
Q47: Use the following graph showing two budget
Q48: An individual's demand curve for X<br>A) shows
Q49: refer to the following figure that shows
Q50: refer to the following figure:<br> <img
Q51: Fill-in-the-Blank<br>-The rate at which a consumer can