Short Answer
Use the following information for questions:
The heights (in inches) and foot lengths (in centimeters) of 32 college men were used to develop a model for the relationship between height and foot length. The scatterplot shows that a linear model is appropriate. SPSS output is provided below. 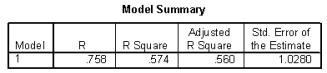
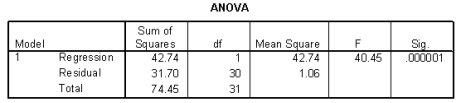
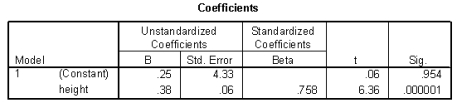
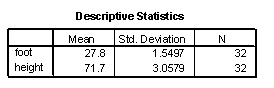
-Calculate a 95% confidence interval for the average foot length for all college men who are 70 inches tall. Descriptive statistics for the two variables are provided below. Use the mean to obtain and note that  = 289.87
Correct Answer:

Verified
Correct Answer:
Verified
Q43: Use the following information for questions:<br>
Q44: Use the following information for questions:<br>
Q45: Use the following information for questions:<br>
Q46: Consider the following plot of residuals versus
Q47: Use the following information for questions:<br> The
Q49: Shown below is a scatterplot of y
Q50: Use the following information for questions:<br> Data
Q51: Use the following information for questions:<br>
Q52: Use the following information for questions:<br>
Q53: Use the following information for questions:<br> The