Multiple Choice
Use the following information for questions:
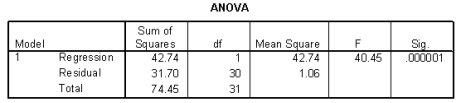
The heights (in inches) and foot lengths (in centimeters) of 32 college men were used to develop a model for the relationship between height and foot length. The scatterplot shows that a linear model is appropriate. SPSS output is provided below. 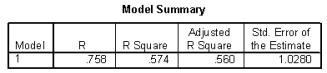
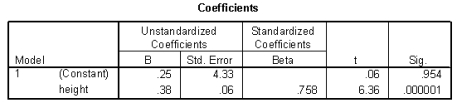
-Max is 70 inches tall. If a 95% prediction interval for his foot length were calculated, the width of this interval would _______ with respect to the interval from question 99.
A) increase
B) decrease
Correct Answer:

Verified
Correct Answer:
Verified
Q42: Use the following information for questions:<br>A consumer
Q43: Use the following information for questions:<br>
Q44: Use the following information for questions:<br>
Q45: Use the following information for questions:<br>
Q46: Consider the following plot of residuals versus
Q48: Use the following information for questions:<br>
Q49: Shown below is a scatterplot of y
Q50: Use the following information for questions:<br> Data
Q51: Use the following information for questions:<br>
Q52: Use the following information for questions:<br>