Essay
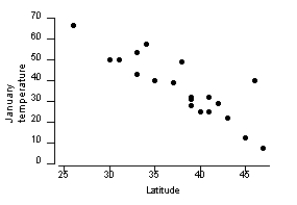
A scatterplot of geographic latitude (X) and average January temperature (Y) for 20 cities in the United States is given below. Is there a positive association or a negative association? Explain what such an association means in the context of this situation.
Correct Answer:

Verified
There is a negative associatio...View Answer
Unlock this answer now
Get Access to more Verified Answers free of charge
Correct Answer:
Verified
View Answer
Unlock this answer now
Get Access to more Verified Answers free of charge
Q38: Based on 1988 census data for the
Q39: Use the following information for questions:<br>
Q40: A regression line can be used to
Q41: Which graph shows a pattern that
Q42: Which one of the following is a
Q44: You wish to describe the relationship between
Q45: Use the following information for questions:<br> Past
Q46: What are influential observations and where are
Q47: Use the following information for questions:<br>
Q48: The scatterplot below shows students' heights (y)