Short Answer
The scatterplot below shows students' heights (y) versus father's heights (x) for a sample of 173 college students. The symbol "+" represents a male student and the symbol "o" represents a female student.
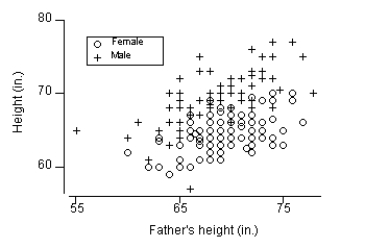 A linear regression equation is determined for the relationship between female students' heights and their father's heights and, separately, one for male students and their fathers. How do the y-intercepts compare for these two regression equations?
Correct Answer:

Verified
The y-intercept for the female...View Answer
Unlock this answer now
Get Access to more Verified Answers free of charge
Correct Answer:
Verified
View Answer
Unlock this answer now
Get Access to more Verified Answers free of charge
Q43: A scatterplot of geographic latitude (X) and
Q44: You wish to describe the relationship between
Q45: Use the following information for questions:<br> Past
Q46: What are influential observations and where are
Q47: Use the following information for questions:<br>
Q49: Use the following information for questions:<br>
Q50: Use the following information for questions:<br> The
Q51: A psychology student wishes to determine the
Q52: A counselor at a weight-loss clinic wishes
Q53: The regression line for a set