Multiple Choice
Consider the following graph: 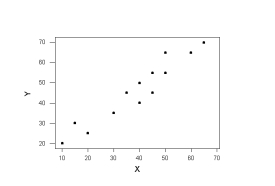 For these data, there is
A) positive correlation.
B) negative correlation.
C) biased correlation.
D) zero correlation.
Correct Answer:

Verified
Correct Answer:
Verified
Related Questions
Q49: Use the following information for questions:<br>
Q50: Use the following information for questions:<br> The
Q51: A psychology student wishes to determine the
Q52: A counselor at a weight-loss clinic wishes
Q53: The regression line for a set
Q55: In a certain study the relationship
Q56: Suppose a study of employees at a
Q57: Which of the following sets of variables
Q58: A scatterplot of y = height and
Q59: Use the following information for questions:<br>