Short Answer
Use the following information for questions:
The following output is for a simple regression in which y = grade point average (GPA) and x = number of classes skipped in a typical week. The results were determined using self-reported data for a sample of n = 1,673 students at a large northeastern university.
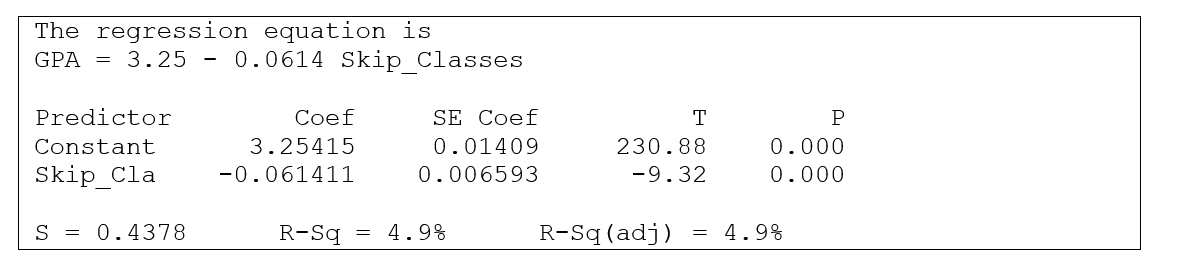
-What is the predicted grade point average for a student who skips 4 classes per typical week?
Correct Answer:

Verified
The predic...View Answer
Unlock this answer now
Get Access to more Verified Answers free of charge
Correct Answer:
Verified
View Answer
Unlock this answer now
Get Access to more Verified Answers free of charge
Q45: Use the following information for questions:<br> Past
Q46: What are influential observations and where are
Q47: Use the following information for questions:<br>
Q48: The scatterplot below shows students' heights (y)
Q49: Use the following information for questions:<br>
Q51: A psychology student wishes to determine the
Q52: A counselor at a weight-loss clinic wishes
Q53: The regression line for a set
Q54: Consider the following graph: <img src="https://d2lvgg3v3hfg70.cloudfront.net/TB10510/.jpg" alt="Consider
Q55: In a certain study the relationship