Essay
Use the following supply schedule for cherries to draw a graph of the supply curve. Be sure to label the supply curve and each axis, and show each point on the supply curve.
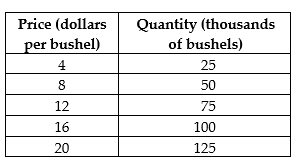
Correct Answer:

Verified
Correct Answer:
Verified
Related Questions
Q4: If the amount of athletic shoes purchased
Q5: As a result of fracking, _ had
Q6: <img src="https://d2lvgg3v3hfg70.cloudfront.net/TB10505/.jpg" alt=" -Refer to Figure
Q7: Nearly one-fifth of China's 1.4 billion people
Q8: How does the decreasing use of DVD
Q10: In December 2019, the minimum age to
Q11: Suppose the cost of harvesting merino wool
Q12: Technological advances have resulted in lower prices
Q13: <img src="https://d2lvgg3v3hfg70.cloudfront.net/TB10505/.jpg" alt=" -Refer to Figure
Q14: If consumers believe the price of OLED