Multiple Choice
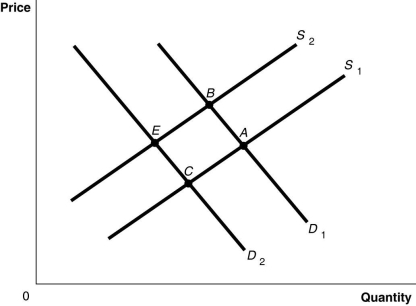
-Refer to Figure 3-8. The graph in this figure illustrates an initial competitive equilibrium in the market for apples at the intersection of D2 and S2 (point E) . Which of the following changes would cause the equilibrium to change to point A?
A) a positive change in the technology used to produce apples and decrease in the price of oranges, a substitute for apples
B) an increase in the wages of apple workers and a decrease in the price of oranges, a substitute for apples
C) an increase in the number of apple producers and a decrease in the number of apple trees as a result of disease
D) a decrease in the wages of apple workers and an increase in the price of oranges, a substitute for apples
Correct Answer:

Verified
Correct Answer:
Verified
Q1: Which of the following generation categories has
Q2: Use the following demand schedule for apples
Q3: Technological advancements have led to lower prices
Q4: If the amount of athletic shoes purchased
Q5: As a result of fracking, _ had
Q7: Nearly one-fifth of China's 1.4 billion people
Q8: How does the decreasing use of DVD
Q9: Use the following supply schedule for cherries
Q10: In December 2019, the minimum age to
Q11: Suppose the cost of harvesting merino wool