Essay
For the data below, construct a frequency histogram and a frequency polygon.
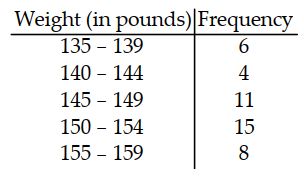
Correct Answer:

Verified
Correct Answer:
Verified
Related Questions
Q37: Given the frequency distribution: <img src="https://d2lvgg3v3hfg70.cloudfront.net/TB10520/.jpg" alt="Given
Q38: One of the advantages of frequency distributions
Q39: Following are the numbers of minutes it
Q40: In a graph of frequency distribution with
Q41: It is possible for the class boundaries
Q43: For the data below, construct an ogive.<br>
Q44: Table 1<br>A sample of 80 company employees
Q45: A bar chart of a frequency distribution
Q46: The sum of the frequencies in a
Q47: In constructing a frequency distribution from raw