Multiple Choice
Given the frequency distribution: 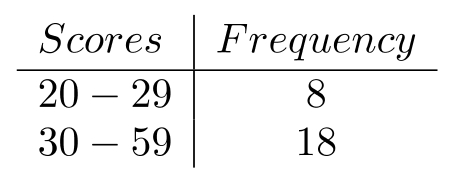 For the histogram of this distribution, the height of the 30-59 interval should be _______
A) 18
B) 9
C) 54
D) 6
Correct Answer:

Verified
Correct Answer:
Verified
Related Questions
Q32: Pie charts are graphical representations of _
Q33: A frequency polygon is a line graph
Q34: For the data below, construct an ogive.<br>
Q35: An ogive of a cumulative "less than"
Q36: We can show the proportion of values
Q38: One of the advantages of frequency distributions
Q39: Following are the numbers of minutes it
Q40: In a graph of frequency distribution with
Q41: It is possible for the class boundaries
Q42: For the data below, construct a frequency