Related Questions
Q29: Which of the following would be a
Q30: List the data which correspond to
Q31: The heights (in inches) of 30
Q32: Pie charts are graphical representations of _
Q33: A frequency polygon is a line graph
Q35: An ogive of a cumulative "less than"
Q36: We can show the proportion of values
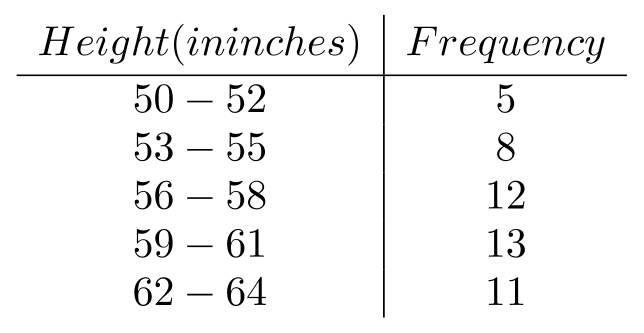
Q37: Given the frequency distribution: <img src="https://d2lvgg3v3hfg70.cloudfront.net/TB10520/.jpg" alt="Given
Q38: One of the advantages of frequency distributions
Q39: Following are the numbers of minutes it