Short Answer
The frequency distribution of grades on a test for a class of 30 students is given below:
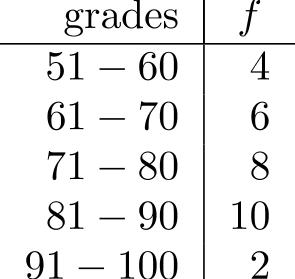
-Find the standard deviation of the grades.
Correct Answer:

Verified
Correct Answer:
Verified
Related Questions
Q28: In a boxplot, if the median is
Q29: In order to compare the values
Q30: The grades obtained on a test
Q31: A denominator of <span class="ql-formula"
Q32: The symbol <span class="ql-formula" data-value="\sigma"><span
Q34: In order to compare the variability of
Q35: Table 2<br>Two companies have the following sales
Q36: A disadvantage that the range has compared
Q37: The midrange is a measure of variation.
Q38: A measure of variation that is greatly