Essay
Table 2
Two companies have the following sales results for a particular month.
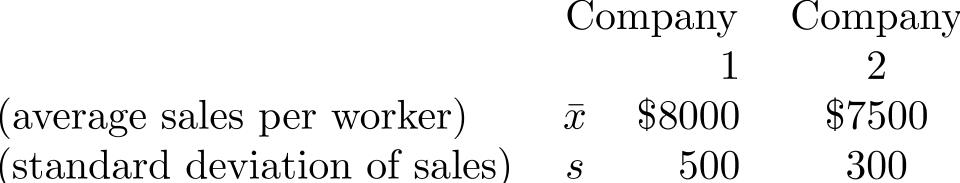
-Use the data in Table 2 to solve the following:
Give the coefficient of variation of the sales of each of the two companies.
Correct Answer:

Verified
c.v. 
1. c...View Answer
Unlock this answer now
Get Access to more Verified Answers free of charge
Correct Answer:
Verified
1. c...
View Answer
Unlock this answer now
Get Access to more Verified Answers free of charge
Q30: The grades obtained on a test
Q31: A denominator of <span class="ql-formula"
Q32: The symbol <span class="ql-formula" data-value="\sigma"><span
Q33: The frequency distribution of grades on a
Q34: In order to compare the variability of
Q36: A disadvantage that the range has compared
Q37: The midrange is a measure of variation.
Q38: A measure of variation that is greatly
Q39: One advantage of the computing formula for
Q40: The mean, median, and standard deviation of