Short Answer
Table 16.1
The table below shows annual profit figures (in thousands of dollars) for a company.
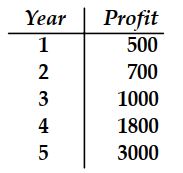
-Fit a power curve to the data in Table 16.1.
Correct Answer:

Verified
Correct Answer:
Verified
Related Questions
Q26: Multiple regression involves at least two dependent
Q27: In regression analysis, the variable that we
Q28: A confidence interval for a future
Q29: The estimated and true regression lines are
Q30: Table 16.2<br>The data gives the number
Q32: The symbol that represents the true
Q33: If paired data plotted on semi-log paper
Q34: The advertising expense and profit of
Q35: The width of a confidence interval
Q36: The standard deviation measures the dispersion