Short Answer
Table 16.2
The data gives the number of year olds (for the given years) whose families earn between per year and the number of U.S. college students for the given year ( ).
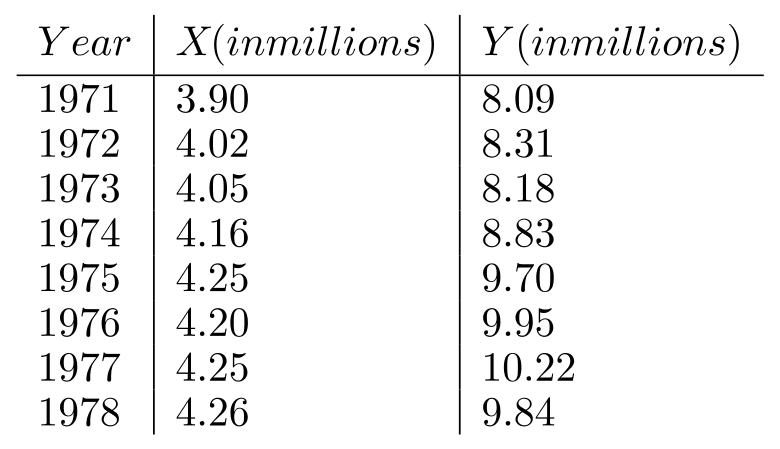
-Use the data in Table 16.2 to:
a. Find the least-squares regression equation which predicts from .
b. Find the standard error of estimate.
c. Predict if .
Correct Answer:

Verified
a. 
b. 0.3...View Answer
Unlock this answer now
Get Access to more Verified Answers free of charge
Correct Answer:
Verified
b. 0.3...
View Answer
Unlock this answer now
Get Access to more Verified Answers free of charge
Q25: The symbols used for the estimated regression
Q26: Multiple regression involves at least two dependent
Q27: In regression analysis, the variable that we
Q28: A confidence interval for a future
Q29: The estimated and true regression lines are
Q31: Table 16.1<br>The table below shows annual profit
Q32: The symbol that represents the true
Q33: If paired data plotted on semi-log paper
Q34: The advertising expense and profit of
Q35: The width of a confidence interval