Multiple Choice
Based on this graph of the number of sunspots per month data from the U.S. Dept. of Commerce, NOAA, Space Weather Prediction Center (SWPC) , when can we expect the next significant disruption to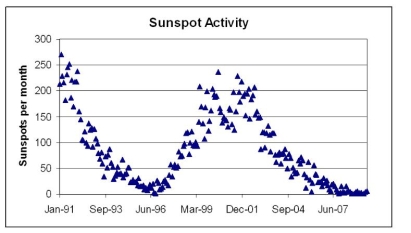 electronic communications?
A) 2008 (just happened)
B) 2012
C) 2018
D) 2023
Correct Answer:

Verified
Correct Answer:
Verified
Related Questions
Q2: How would an increase in rotational tilt
Q3: The Earth is closer to the Sun
Q4: Analyze the map and select the proper
Q5: Which diagram best summarizes the structure of
Q6: If Earth did not have an atmosphere,
Q7: Why are there seasons?<br>A) Earth gets closer
Q8: How do scientists estimate the age of
Q9: Temperatures on Earth would be lower if
Q10: If Earth was smaller it would have
Q11: Analyze the map and select the proper