Multiple Choice
Figure 50.2 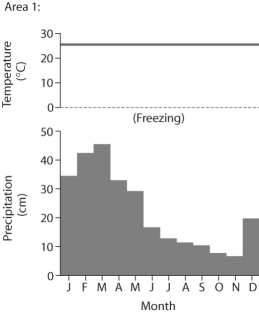
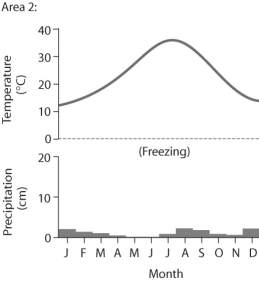
-Based on the data in Figure 50.2,which of the following statements is false?
A) Area 1 has more average precipitation than area 2.
B) Area 1 would be considered a desert because of its high average temperature.
C) Area 2 would be considered a desert because of its low average precipitation.
D) Area 2 has a large annual temperature variation.
Correct Answer:

Verified
Correct Answer:
Verified
Q22: Which of the following is not a
Q24: Use the following abstract from the International
Q27: Cheatgrass has been able to invade dry,temperate
Q30: Figure 50.3 <img src="https://d2lvgg3v3hfg70.cloudfront.net/TB3733/.jpg" alt="Figure 50.3
Q33: Figure 50.3 <img src="https://d2lvgg3v3hfg70.cloudfront.net/TB3733/.jpg" alt="Figure 50.3
Q34: Figure 50.1 <img src="https://d2lvgg3v3hfg70.cloudfront.net/TB3733/.jpg" alt="Figure 50.1
Q35: Every place on Earth receives the same
Q36: In the limnetic zone,you are most likely
Q37: Figure 50.2<br> <img src="https://d2lvgg3v3hfg70.cloudfront.net/TB3734/.jpg" alt="Figure 50.2
Q38: Use the following abstract from the International