Multiple Choice
Figure 50.3 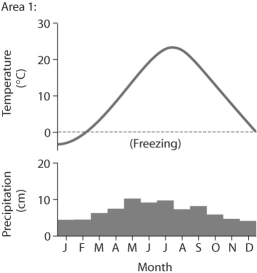
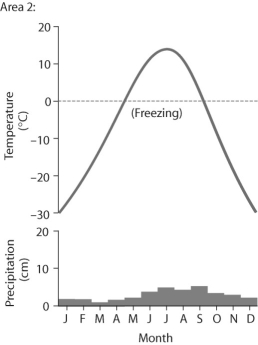
-Based on the data in the figure above,which of the following statements is false?
A) Area 1 has more average precipitation than area 2.
B) Area 1 has a higher average temperature than area 2.
C) Both areas have variation in monthly precipitation.
D) Area 2 has a smaller annual temperature variation compared to area 1.
Correct Answer:

Verified
Correct Answer:
Verified
Q7: You are measuring the effect of increased
Q22: Which of the following is not a
Q24: Use the following abstract from the International
Q28: Which of the following statements regarding turnover
Q30: Figure 50.3 <img src="https://d2lvgg3v3hfg70.cloudfront.net/TB3733/.jpg" alt="Figure 50.3
Q31: Figure 50.2 <img src="https://d2lvgg3v3hfg70.cloudfront.net/TB3733/.jpg" alt="Figure 50.2
Q34: Figure 50.1 <img src="https://d2lvgg3v3hfg70.cloudfront.net/TB3733/.jpg" alt="Figure 50.1
Q35: Every place on Earth receives the same
Q36: In the limnetic zone,you are most likely
Q38: Use the following abstract from the International