Multiple Choice
(a) Density dependence: Growth rate slows at high density.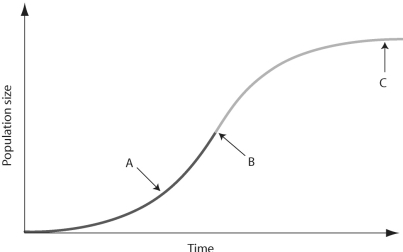 Figure 51.5
-In the figure above, which of the arrows represents the most rapid growth?
A) arrow A
B) arrow B
C) arrow C
Correct Answer:

Verified
Correct Answer:
Verified
Q23: <img src="https://d2lvgg3v3hfg70.cloudfront.net/TB6548/.jpg" alt=" Figure 51.10 -Projections
Q24: <span class="ql-formula" data-value="\text {Life Table for Lacerta
Q25: Which of the following statements regarding the
Q26: <span class="ql-formula" data-value="\text {Life Table for Lacerta
Q27: Why can't a female lizard have both
Q29: What can we NOT determine from examining
Q30: <img src="https://d2lvgg3v3hfg70.cloudfront.net/TB6548/.jpg" alt=" Figure 51.10 -Based
Q31: <img src="https://d2lvgg3v3hfg70.cloudfront.net/TB6548/.jpg" alt="
Q32: Suppose researchers marked 800 turtles and later
Q33: Which statement about K is FALSE?<br>A) K