Solve the Problem. -The Stem and Leaf Plot Depicts the Debt-To-Income Ratios of Debt-To-Income
Multiple Choice
Solve the problem.
-The stem and leaf plot depicts the debt-to-income ratios of loan applicants at a nearby bank.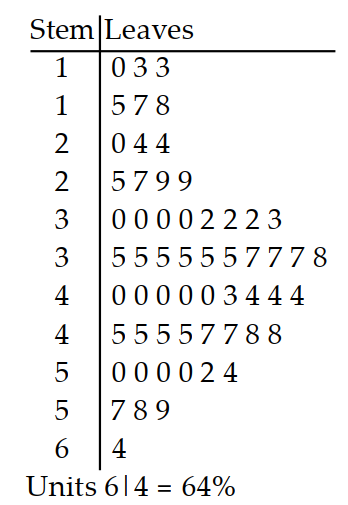
Describe the shape of the distribution.
A) Uniform
B) Right skewed
C) Left skewed
D) Normal
Correct Answer:

Verified
Correct Answer:
Verified
Q55: Describe the shape of the given histogram.<br>-<img
Q56: Prepare a frequency distribution for the
Q57: Find the mean for the list
Q58: Solve the problem.<br>-The stem and leaf plot
Q59: Calculate the weighted average.<br>-Boris enrolled in
Q61: Find the standard deviation of the data
Q62: Find the median.<br>- <span class="ql-formula" data-value="47,20,7,5,27,13,21,42,37,31"><span
Q63: Find the mean for the frequency distribution.
Q64: At one high school, students can
Q65: Solve the problem.<br>-The stem and leaf plot