Solved
Solve the Problem. -The Stem and Leaf Plot Depicts the Debt-To-Income Ratios of Debt-To-Income
Multiple Choice
Solve the problem.
-The stem and leaf plot depicts the debt-to-income ratios of loan applicants at a nearby bank.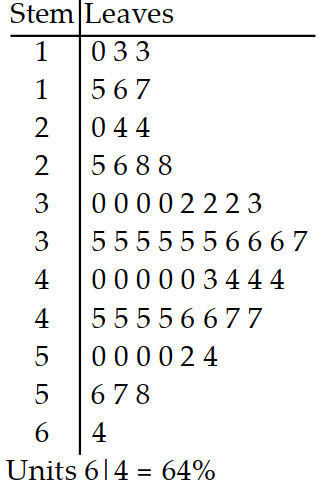
Do more applicants have debt-to-income ratios in the 20's or 50's?
A) 20 's
B) 50 's
Correct Answer:

Verified
Correct Answer:
Verified
Related Questions
Q60: Solve the problem.<br>-The stem and leaf plot
Q61: Find the standard deviation of the data
Q62: Find the median.<br>- <span class="ql-formula" data-value="47,20,7,5,27,13,21,42,37,31"><span
Q63: Find the mean for the frequency distribution.
Q64: At one high school, students can
Q66: Find a <span class="ql-formula" data-value="z"><span
Q67: Find the area under the normal
Q68: Find the area under the normal
Q69: In a certain distribution, the mean
Q70: Find the mean for the frequency distribution.