Multiple Choice
The graph shows the total sales in thousand of dollars from the distribution of x thousand catalogs. Find the average rate of change of sales with respect to the number of catalogs distributed for the change in x.
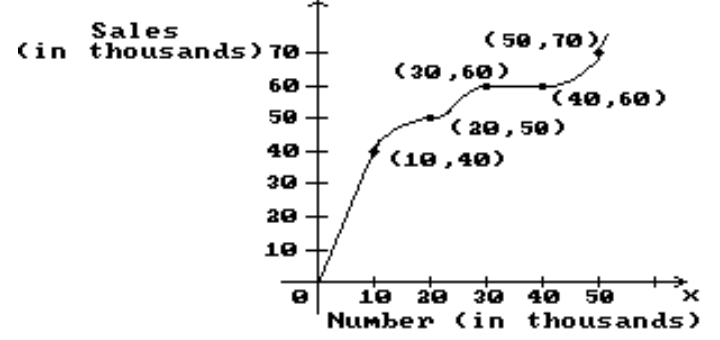
-20 to 30
A) 1
B)
C)
D) 2
Correct Answer:

Verified
Correct Answer:
Verified
Related Questions
Q180: Solve the problem.<br>-A particle is moving
Q181: Use the properties of limits to
Q182: Solve the problem.}<br>-A car rental firm
Q183: Use a calculator to estimate the
Q184: Solve the problem.<br>-Suppose the demand for
Q186: Decide whether the limit exists. If
Q187: Use the properties of limits to
Q188: Solve the problem.<br>-The power <span
Q189: Use the quotient rule to find
Q190: Solve the problem.<br>-The cost of manufacturing