Essay
The following scatterplot displays the rushing yardage per game vs. number of rushes for LaDainian Tomlinson in the 2006 National Football League season. Also displayed is the least squares line.
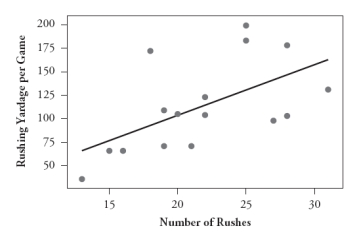 The equation of the least squares line is predicted rushing yards = -3.69 + 5.37 × number of rushes.
The value of r2 is .332.
-Which game has the greatest residual (in absolute value)? Identify it by how many rushes Tomlinson had in that game and also by circling it on the graph.
Correct Answer:

Verified
The game with the largest resi...View Answer
Unlock this answer now
Get Access to more Verified Answers free of charge
Correct Answer:
Verified
View Answer
Unlock this answer now
Get Access to more Verified Answers free of charge
Q6: The following data are the age (in
Q7: The following scatterplots display the price vs.
Q8: The following data are the age (in
Q9: It can be shown that the sum
Q10: The following scatterplot displays the rushing yardage
Q12: A statistician found data in an advertisement
Q13: The following scatterplot displays the rushing yardage
Q14: a. Suppose everyone in your class scores
Q15: Think of an example, not discussed in
Q16: A statistician found data in an advertisement