Short Answer
The following scatterplots display the price vs. age for a sample of Hanoverian-bred dressage horses listed for sale on the Internet. The graph on the left displays these data for female horses, the graph on the right for male horses: 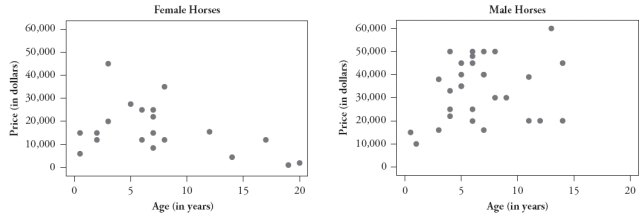
1. Is the oldest horse in this sample male or female?
2. Is the most expensive horse in this sample male or female?
3. Which horse would you predict to cost more: a 10-year-old male horse or a 10-year-old female horse?
4. Which gender has a positive association between price and age?
5. Which gender has the stronger association between price and age?
Correct Answer:

Verified
1.The oldest horse in this sample is fem...View Answer
Unlock this answer now
Get Access to more Verified Answers free of charge
Correct Answer:
Verified
View Answer
Unlock this answer now
Get Access to more Verified Answers free of charge
Q2: Scientists have studied whether one can predict
Q3: For the homeowner's utility data studied in
Q4: The following data are the age (in
Q5: A sample of students at a university
Q6: The following data are the age (in
Q8: The following data are the age (in
Q9: It can be shown that the sum
Q10: The following scatterplot displays the rushing yardage
Q11: The following scatterplot displays the rushing yardage
Q12: A statistician found data in an advertisement