Essay
The following histogram displays the magnitudes of the 614 earthquakes with Richter scale magnitude greater than 1.0 that occurred in the United States between March 25 and April 1, 2004: 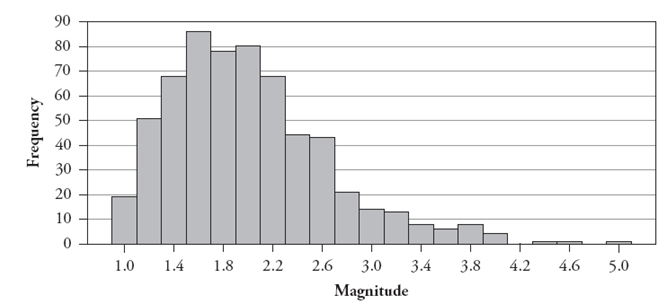
-Which histogram do you think displays the variable number of siblings? Justify your answer.
Correct Answer:

Verified
Histogram displays the variabl...View Answer
Unlock this answer now
Get Access to more Verified Answers free of charge
Correct Answer:
Verified
View Answer
Unlock this answer now
Get Access to more Verified Answers free of charge
Q4: Create an example of five hypothetical
Q5: The following side-by-side stemplot displays the total
Q6: The following table reports counts of the
Q7: What effect does adding 10 points to
Q8: The following histogram displays the magnitudes of
Q10: The following table reports counts of the
Q11: The following side-by-side stemplot displays the total
Q12: Would a manufacturer of candy bars want
Q13: The following histogram displays the life expectancies
Q14: Construct a hypothetical example of ten exam