Short Answer
The following histogram displays the life expectancies (in years), as reported by The World Almanac and Book of Facts 2006, for a sample of 22 countries: 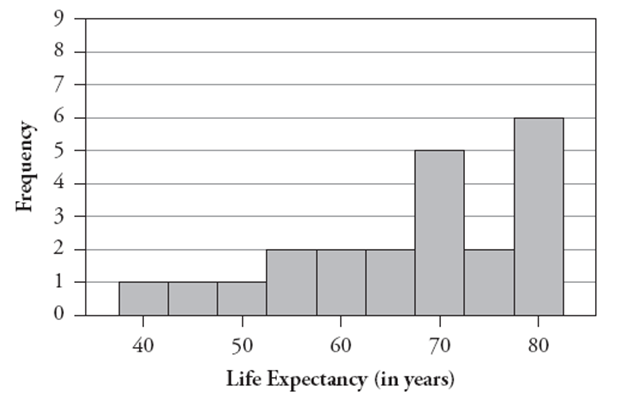
a. Describe (in five words or less) the shape of this distribution.
b. Two measures of center for this distribution are 67.0 and 70.7. One of these is the mean and the other is the median. Which is which? Explain your choice.
Now consider a histogram of the numbers of televisions per thousand people in these countries: 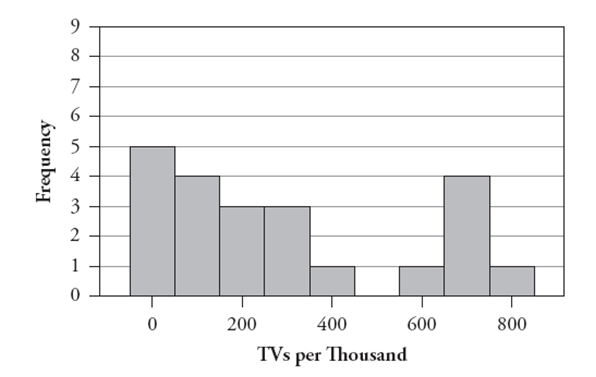 c. Write a paragraph describing key features of this distribution.
Correct Answer:

Verified
a. The distribution of life expectancies...View Answer
Unlock this answer now
Get Access to more Verified Answers free of charge
Correct Answer:
Verified
View Answer
Unlock this answer now
Get Access to more Verified Answers free of charge
Q8: The following histogram displays the magnitudes of
Q9: The following histogram displays the magnitudes of
Q10: The following table reports counts of the
Q11: The following side-by-side stemplot displays the total
Q12: Would a manufacturer of candy bars want
Q14: Construct a hypothetical example of ten exam
Q15: Create an example of five hypothetical exam
Q16: In a recent study, researchers followed 104,000
Q17: The following side-by-side stemplot displays the total
Q18: Suppose Mary records the ages of people