Short Answer
The following side-by-side stemplot displays the total number of points scored per Super Bowl football game for the first 41 Super Bowls (from 1967-2007), separated according to the first 20 games (19671986) and the next 21 games (1987-2007): 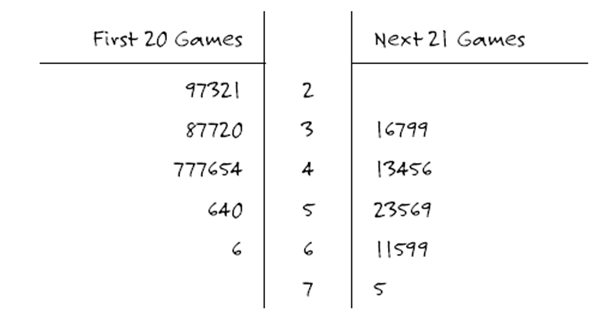
-Compare and contrast the distributions of total points between these two groups. Refer to appropriate calculations and displays to support your comments.
Correct Answer:

Verified
The total number of points scored in a S...View Answer
Unlock this answer now
Get Access to more Verified Answers free of charge
Correct Answer:
Verified
View Answer
Unlock this answer now
Get Access to more Verified Answers free of charge
Q39: An instructor conducted an in-class experiment where
Q40: The following histogram displays the magnitudes
Q41: In a study reported in the July
Q42: The following side-by-side stemplot displays the total
Q43: Suppose Ben records the noon temperature in
Q45: Is it possible for the mean value
Q46: The following side-by-side stemplot displays the total
Q47: The following histogram displays the magnitudes of
Q48: The following histograms display the distributions of
Q49: In a study reported in the July