Essay
The following histogram displays the magnitudes of the 614 earthquakes with Richter scale magnitude greater than 1.0 that occurred in the United States between March 25 and April 1, 2004: 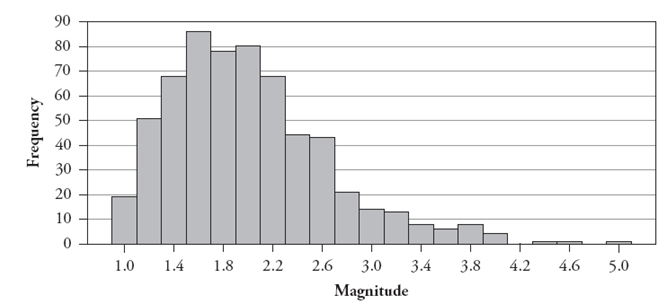
-Describe the shape of this distribution.
Correct Answer:

Verified
This histo...View Answer
Unlock this answer now
Get Access to more Verified Answers free of charge
Correct Answer:
Verified
View Answer
Unlock this answer now
Get Access to more Verified Answers free of charge
Q42: The following side-by-side stemplot displays the total
Q43: Suppose Ben records the noon temperature in
Q44: The following side-by-side stemplot displays the total
Q45: Is it possible for the mean value
Q46: The following side-by-side stemplot displays the total
Q48: The following histograms display the distributions of
Q49: In a study reported in the July
Q50: A trimmed mean is another measure
Q51: The following histograms display the distributions of
Q52: The following table reports counts of the