Short Answer
In a recent study, researchers purchased 40 food items in New York City and determined the actual calorie content of each through a laboratory analysis. They then calculated the percentage difference between the actual calorie content and the calorie count listed on the item's label. (A positive percentage difference corresponds to a food item whose actual calorie content was higher than what the label claimed.) Each food item was also classified according to whether it was marketed locally, nationally, or regionally. The boxplots below were constructed to compare the distributions: 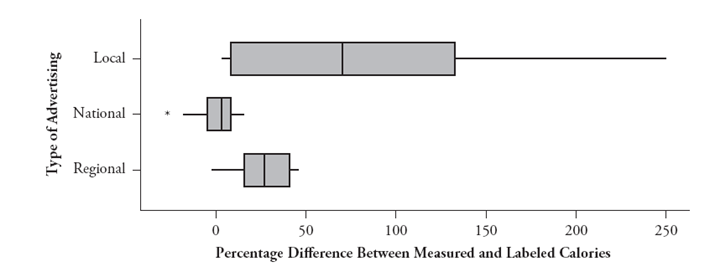
Write a paragraph summarizing what these boxplots reveal about the percentage differences between measured and labeled calorie content among the three groups of food items.
Correct Answer:

Verified
The most striking aspect of these data i...View Answer
Unlock this answer now
Get Access to more Verified Answers free of charge
Correct Answer:
Verified
View Answer
Unlock this answer now
Get Access to more Verified Answers free of charge
Q15: Create an example of five hypothetical exam
Q16: In a recent study, researchers followed 104,000
Q17: The following side-by-side stemplot displays the total
Q18: Suppose Mary records the ages of people
Q19: What effect does adding ten points to
Q21: Is the mean absolute deviation more or
Q22: In a study reported in the July
Q23: Create an example of five hypothetical exam
Q24: The following histograms display the distributions of
Q25: The 2001_2002 National Health and Nutrition Examination