Short Answer
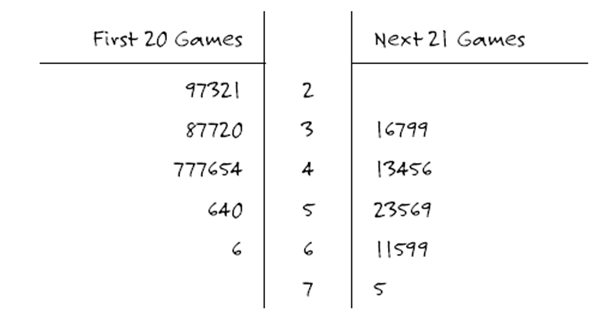
The following side-by-side stemplot displays the total number of points scored per Super Bowl football game for the first 41 Super Bowls (from 1967-2007), separated according to the first 20 games (19671986) and the next 21 games (1987-2007): 
-Construct boxplots of the distributions of total points in these two groups, using the same axes and scale. (Do not bother to check for outliers; there are no outliers in either distribution.)
Correct Answer:

Verified
Correct Answer:
Verified
Q12: Would a manufacturer of candy bars want
Q13: The following histogram displays the life expectancies
Q14: Construct a hypothetical example of ten exam
Q15: Create an example of five hypothetical exam
Q16: In a recent study, researchers followed 104,000
Q18: Suppose Mary records the ages of people
Q19: What effect does adding ten points to
Q20: In a recent study, researchers purchased 40
Q21: Is the mean absolute deviation more or
Q22: In a study reported in the July