menu-iconExamlexExamLexServices

Discover

Ask a Question
  1. All Topics
  2. Topic
    Statistics
  3. Study Set
    Statistics Principles
  4. Exam
    Exam 2: Organization and Description of Data
  5. Question
    Find the Histogram That Better Describes the Data
Solved

Find the Histogram That Better Describes the Data

Question 9

Question 9

Short Answer

Find the histogram that better describes the data.
Find the histogram that better describes the data.     Find the histogram that better describes the data.

Correct Answer:

verifed

Verified

Unlock this answer now
Get Access to more Verified Answers free of charge

Related Questions

Q4: Find the variance of the following data

Q5: A report on the points gained by

Q6: If M is the mean of x<sub>1</sub>,

Q7: A football fan recorded the total number

Q8: In a recent basketball season, one-star player

Q10: Five students reported the number of

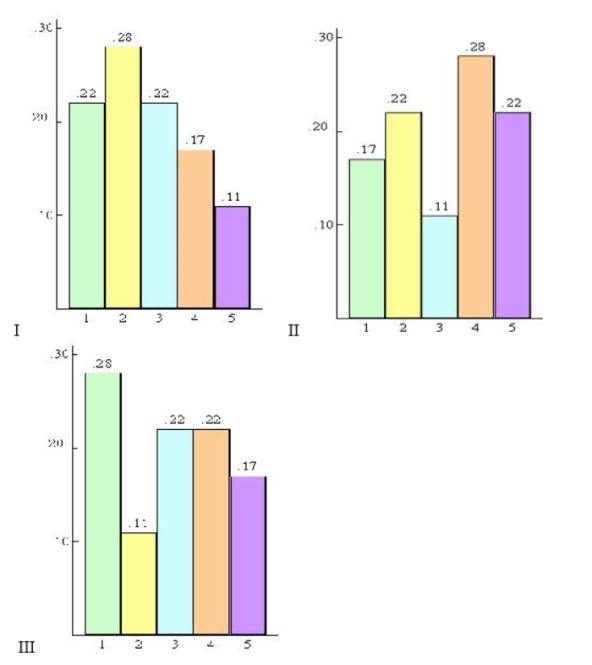
Q11: Refer to the data.<br> <img src="https://d2lvgg3v3hfg70.cloudfront.net/TB10841/.jpg"

Q12: The following data represents the Tampa Buccaneers

Q13: For the data concerning the number

Q14: The table below shows the attendance to

Examlex

ExamLex

About UsContact UsPerks CenterHomeschoolingTest Prep

Work With Us

Campus RepresentativeInfluencers

Links

FaqPricingChrome Extension

Download The App

Get App StoreGet Google Play

Policies

Privacy PolicyTerms of ServiceHonor CodeCommunity Guidelines

Scan To Download

qr-code

Copyright © (2025) ExamLex LLC.

Privacy PolicyTerms Of ServiceHonor CodeCommunity Guidelines