Short Answer
The table below shows the attendance to the Super Bowl for 14 years
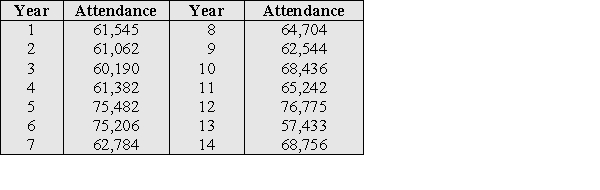
a) Find the 10th percentile.
b) Find the interquartile range.
Correct Answer:

Verified
Correct Answer:
Verified
Related Questions
Q9: Find the histogram that better describes the
Q10: Five students reported the number of
Q11: Refer to the data.<br> <img src="https://d2lvgg3v3hfg70.cloudfront.net/TB10841/.jpg"
Q12: The following data represents the Tampa Buccaneers
Q13: For the data concerning the number
Q15: Both, categorical and numerical data can be
Q16: For the data set 6 10 1<br>a)
Q17: During a recent regular season, the Orlando
Q18: Calculate the mean and median of the
Q19: In describing a data set of measurements,