Multiple Choice
Figure 13.1
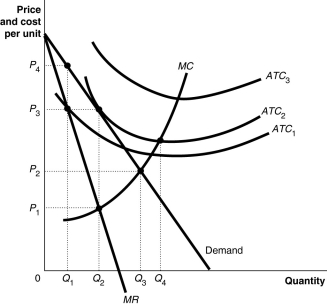
Figure 13.1 above shows the demand and cost curves facing a monopolist.
-Refer to Figure 13.1.The firm's profit-maximizing price is
A) P₁.
B) P₂.
C) P₃.
D) P₄.
Correct Answer:

Verified
Correct Answer:
Verified
Q25: Identify two ways by which the government
Q59: Figure 13.5<br> <img src="https://d2lvgg3v3hfg70.cloudfront.net/TB4178/.jpg" alt="Figure 13.5
Q60: Market power in Canada causes a huge
Q62: Figure 13.3<br> <img src="https://d2lvgg3v3hfg70.cloudfront.net/TB4178/.jpg" alt="Figure 13.3
Q63: A merger between the McCain Foods and
Q65: Figure 13.6<br> <img src="https://d2lvgg3v3hfg70.cloudfront.net/TB4178/.jpg" alt="Figure 13.6
Q67: To enter a local cable television market,
Q95: A monopolist faces<br>A)a perfectly elastic demand curve.<br>B)a
Q121: How does a network externality serve as
Q139: Figure 13.1<br> <img src="https://d2lvgg3v3hfg70.cloudfront.net/TB4178/.jpg" alt="Figure 13.1