Multiple Choice
Figure 13.5
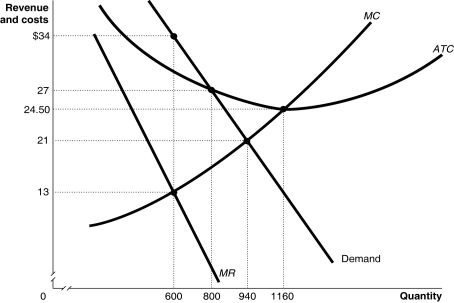
Figure 13.5 shows the demand and cost curves for a monopolist.
-Refer to Figure 13.5.What is the difference between the monopoly output and the perfectly competitive output?
A) 140 units
B) 240 units
C) 340 units
D) 560 units
Correct Answer:

Verified
Correct Answer:
Verified
Q54: Competition Bureau would never approve a proposed
Q55: Figure 13.9<br> <img src="https://d2lvgg3v3hfg70.cloudfront.net/TB4178/.jpg" alt="Figure 13.9
Q57: Figure 13.7<br> <img src="https://d2lvgg3v3hfg70.cloudfront.net/TB4178/.jpg" alt="Figure 13.7
Q58: Figure 13.2<br> <img src="https://d2lvgg3v3hfg70.cloudfront.net/TB4178/.jpg" alt="Figure 13.2
Q60: Market power in Canada causes a huge
Q62: Figure 13.3<br> <img src="https://d2lvgg3v3hfg70.cloudfront.net/TB4178/.jpg" alt="Figure 13.3
Q63: A merger between the McCain Foods and
Q64: Figure 13.1<br> <img src="https://d2lvgg3v3hfg70.cloudfront.net/TB4178/.jpg" alt="Figure 13.1
Q139: Figure 13.1<br> <img src="https://d2lvgg3v3hfg70.cloudfront.net/TB4178/.jpg" alt="Figure 13.1
Q152: A profit-maximizing monopoly's price is<br>A)the same as