Multiple Choice
Figure 13.9
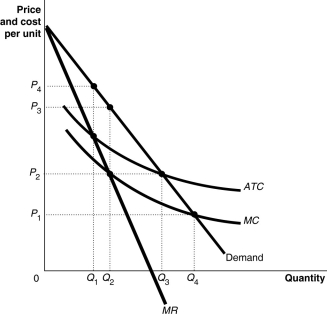
Figure 13.9 shows the cost and demand curves for the Erickson Power Company.
-Refer to Figure 13.9.The firm would maximize profit by producing
A) Q₁ units.
B) Q₂ units.
C) Q₃ units.
D) Q₄ units.
Correct Answer:

Verified
Correct Answer:
Verified
Q15: When a proposed merger between two companies
Q48: Table 13.2<br> <span class="ql-formula" data-value="\begin{array}{|c|c|c|}\hline
Q52: Figure 13.7<br> <img src="https://d2lvgg3v3hfg70.cloudfront.net/TB4178/.jpg" alt="Figure 13.7
Q53: Figure 13.5<br> <img src="https://d2lvgg3v3hfg70.cloudfront.net/TB4178/.jpg" alt="Figure 13.5
Q54: Competition Bureau would never approve a proposed
Q55: Figure 13.9<br> <img src="https://d2lvgg3v3hfg70.cloudfront.net/TB4178/.jpg" alt="Figure 13.9
Q139: In 2011,Microsoft filed a complaint with the
Q152: A profit-maximizing monopoly's price is<br>A)the same as
Q211: Which of the following statements applies to
Q266: Firms do not have market power in