Multiple Choice
Figure 13.9
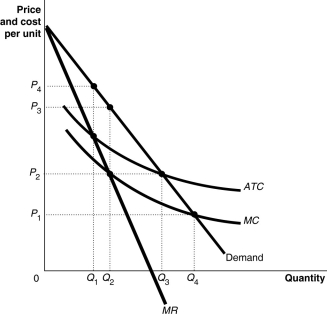
Figure 13.9 shows the cost and demand curves for the Erickson Power Company.
-Refer to Figure 13.9.Erickson Power is a natural monopoly because
A) it is a power company and all power companies are natural monopolies.
B) average total cost is still declining when it intersects demand.
C) of its continually declining marginal revenue curve as output rises.
D) its marginal cost lies entirely below its long-run average cost.
Correct Answer:

Verified
Correct Answer:
Verified
Q51: Figure 13.9<br> <img src="https://d2lvgg3v3hfg70.cloudfront.net/TB4178/.jpg" alt="Figure 13.9
Q52: Figure 13.7<br> <img src="https://d2lvgg3v3hfg70.cloudfront.net/TB4178/.jpg" alt="Figure 13.7
Q53: Figure 13.5<br> <img src="https://d2lvgg3v3hfg70.cloudfront.net/TB4178/.jpg" alt="Figure 13.5
Q54: Competition Bureau would never approve a proposed
Q57: Figure 13.7<br> <img src="https://d2lvgg3v3hfg70.cloudfront.net/TB4178/.jpg" alt="Figure 13.7
Q58: Figure 13.2<br> <img src="https://d2lvgg3v3hfg70.cloudfront.net/TB4178/.jpg" alt="Figure 13.2
Q59: Figure 13.5<br> <img src="https://d2lvgg3v3hfg70.cloudfront.net/TB4178/.jpg" alt="Figure 13.5
Q60: Market power in Canada causes a huge
Q139: In 2011,Microsoft filed a complaint with the
Q152: A profit-maximizing monopoly's price is<br>A)the same as