Multiple Choice
Figure 15.2
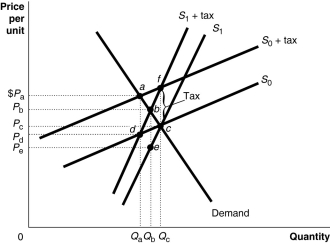
Figure 15.2 shows a demand curve and two sets of supply curves, one set more elastic than the other.
-Refer to Figure 15.2.If the government imposes an excise tax of $1.00 on every unit sold, the consumer's burden of the tax
A) is greater under the more elastic supply curve S₀.
B) is greater under the less elastic supply curve S₀.
C) is greater under the less elastic supply curve S₁.
D) is the same under either supply curve because there is a single demand curve that captures buyers' market behavior.
Correct Answer:

Verified
Correct Answer:
Verified
Q31: For a given supply curve, the deadweight
Q64: Figure 15.2<br> <img src="https://d2lvgg3v3hfg70.cloudfront.net/TB4178/.jpg" alt="Figure 15.2
Q65: Figure 15.2<br> <img src="https://d2lvgg3v3hfg70.cloudfront.net/TB4178/.jpg" alt="Figure 15.2
Q66: Suppose in an effort to raise tax
Q67: Figure 15.2<br> <img src="https://d2lvgg3v3hfg70.cloudfront.net/TB4178/.jpg" alt="Figure 15.2
Q70: Which of the following statements about a
Q73: The actual division of the burden of
Q74: Between 1976 and 2010, income inequality in
Q134: Which of the following is not an
Q167: The median voter theorem will be an