Multiple Choice
Figure 15.2
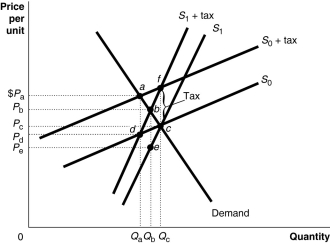
Figure 15.2 shows a demand curve and two sets of supply curves, one set more elastic than the other.
-Refer to Figure 15.2.If the government imposes an excise tax of $1.00 on every unit sold, the government's revenue from the tax
A) is larger if the supply curve is S₀.
B) is larger if the supply curve is S₁.
C) is identical under either supply curve.
D) is not maximized.
Correct Answer:

Verified
Correct Answer:
Verified
Q27: Policymakers focus on marginal tax rate changes
Q62: Table 15.4<br> <span class="ql-formula" data-value="\begin{array}{|c|c|}\hline
Q63: Suppose, on average, a family in Church
Q65: Figure 15.2<br> <img src="https://d2lvgg3v3hfg70.cloudfront.net/TB4178/.jpg" alt="Figure 15.2
Q66: Suppose in an effort to raise tax
Q67: Figure 15.2<br> <img src="https://d2lvgg3v3hfg70.cloudfront.net/TB4178/.jpg" alt="Figure 15.2
Q69: Figure 15.2<br> <img src="https://d2lvgg3v3hfg70.cloudfront.net/TB4178/.jpg" alt="Figure 15.2
Q97: One important difference between the political process
Q156: The idea that two taxpayers in the
Q167: The median voter theorem will be an