Multiple Choice
Figure 3-8
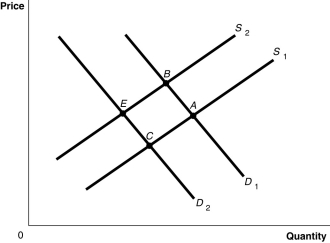
-Refer to Figure 3-8.The graph in this figure illustrates an initial competitive equilibrium in the market for motorcycles at the intersection of D₁ and S₂ (point B) If there is an increase in number of companies producing motorcycles and a decrease in income (assume motorcycles are a normal good) , the equilibrium could move to which point?
A) A
B) B
C) C
D) E
Correct Answer:

Verified
Correct Answer:
Verified
Q62: If the demand for a product increases
Q65: Figure 3-2<br> <img src="https://d2lvgg3v3hfg70.cloudfront.net/TB4193/.jpg" alt="Figure 3-2
Q94: A supply schedule<br>A) is a table that
Q104: The demand for soft drinks in the
Q146: The popularity of digital cameras has enticed
Q155: Assume that the demand curve for DVD
Q204: Figure 3-8<br> <img src="https://d2lvgg3v3hfg70.cloudfront.net/TB4192/.jpg" alt="Figure 3-8
Q214: The following appeared in a Florida newspaper
Q228: Figure 3-1 <img src="https://d2lvgg3v3hfg70.cloudfront.net/TB4188/.jpg" alt="Figure 3-1
Q232: Figure 3-7<br> <img src="https://d2lvgg3v3hfg70.cloudfront.net/TB4193/.jpg" alt="Figure 3-7