Multiple Choice
Figure 3.1
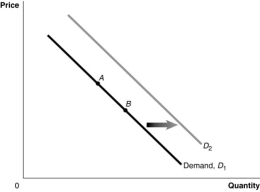
-Refer to Figure 3.1. A increase in taste or preference for the good would be represented by a movement from:
A) A to B.
B) B to A.
C) D₁ to D₂.
D) D₂ to D₁.
Correct Answer:

Verified
Correct Answer:
Verified
Q12: Assume that the hourly price for the
Q48: Quantity supplied refers to the amount of
Q149: Figure 3.8<br> <img src="https://d2lvgg3v3hfg70.cloudfront.net/TB3087/.jpg" alt="Figure 3.8
Q155: With the advent of online classes and
Q156: If the quantity of grapes demanded increases
Q157: Assume there is a shortage in the
Q159: If a firm expects that the price
Q176: Figure 3-1<br> <img src="https://d2lvgg3v3hfg70.cloudfront.net/TB4193/.jpg" alt="Figure 3-1
Q196: Figure 3-5<br> <img src="https://d2lvgg3v3hfg70.cloudfront.net/TB4193/.jpg" alt="Figure 3-5
Q207: The income effect explains why there is